


Macro
Two things drove markets in May 2026: a potential resolution to the Middle East conflict and an AI-driven equity rally that continued to defy the macro backdrop. On the geopolitical front, diplomatic channels between the United States and Iran showed signs of progress [1], with a draft deal to reopen the Strait of Hormuz reportedly gaining traction. [2] The Trump-Xi summit, attended by notable US CEOs including Elon Musk, Jensen Huang, and Tim Cook [3], covered trade, technology access and geopolitical tension. [4] On the technology front, reports have emerged that Washington had cleared H200 chips sales to select Chinese firms (though China halted deliveries) [5], signalling a potential thaw in technology trade relations. Putin visited Beijing days after Trump, signing over 40 agreements on economy, energy, transport and global cooperation. [6]
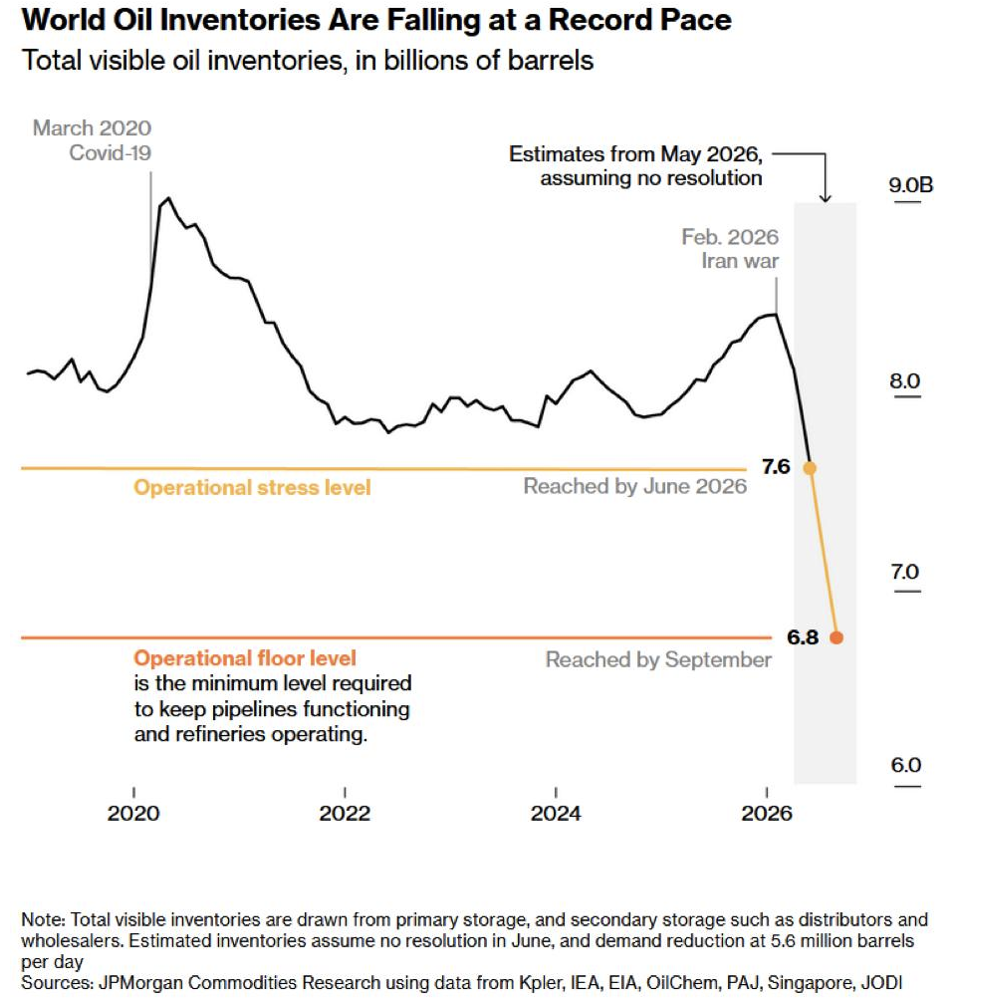
Underpinning both summits was a shared concern about energy supply. With the Strait of Hormuz still disrupted, global oil inventories remained under sustained pressure throughout the period, reflecting cumulative supply disruption since the conflict began. Total visible oil inventories have been declining at a record pace since the Iran war began in February 2026. As per the JPMorgan Commodities Research below, it estimates that if the strait remains closed, stockpiles could breach the operational floor as early as September 2026.
Inflation data remained in focus throughout the period. US PPI rose 1.4% month-on-month in April and 6.0% year-on-year, the largest jump since 2022 [7], seemingly reflecting sustained energy cost pass-through at the producer level. CPI rose to 3.8% for the twelve months ending April, still meaningfully above target.[8] While the full consumer pass-through has not yet materialised, underlying pressure may appear to be building. Any easing in energy prices following a Strait of Hormuz resolution could provide meaningful relief to both metrics.
Prediction markets offer a real-time gauge of how investors are pricing resolution risk. As of late May 2026, Polymarket placed a 60% probability on the Strait of Hormuz returning to normal operations by July 31 (as of 29 May 2026) [9], a meaningful uptick from earlier in the month and consistent with the diplomatic developments described above.
Equities
Despite the challenging geopolitical backdrop, equity markets demonstrated remarkable resilience in May 2026, rallying strongly and largely shrugging off macro headwinds. The disconnect was particularly pronounced in Asia: the KOSPI surged approximately 77% year-to-date [10], climbing from around 5,000 in January to above 8,000, while equities in Taiwan [11] and Japan [12] also reached all-time highs. The common driver may be due to concentrated exposure to AI-related names, which continued to attract significant investor flows and generate outsized returns.
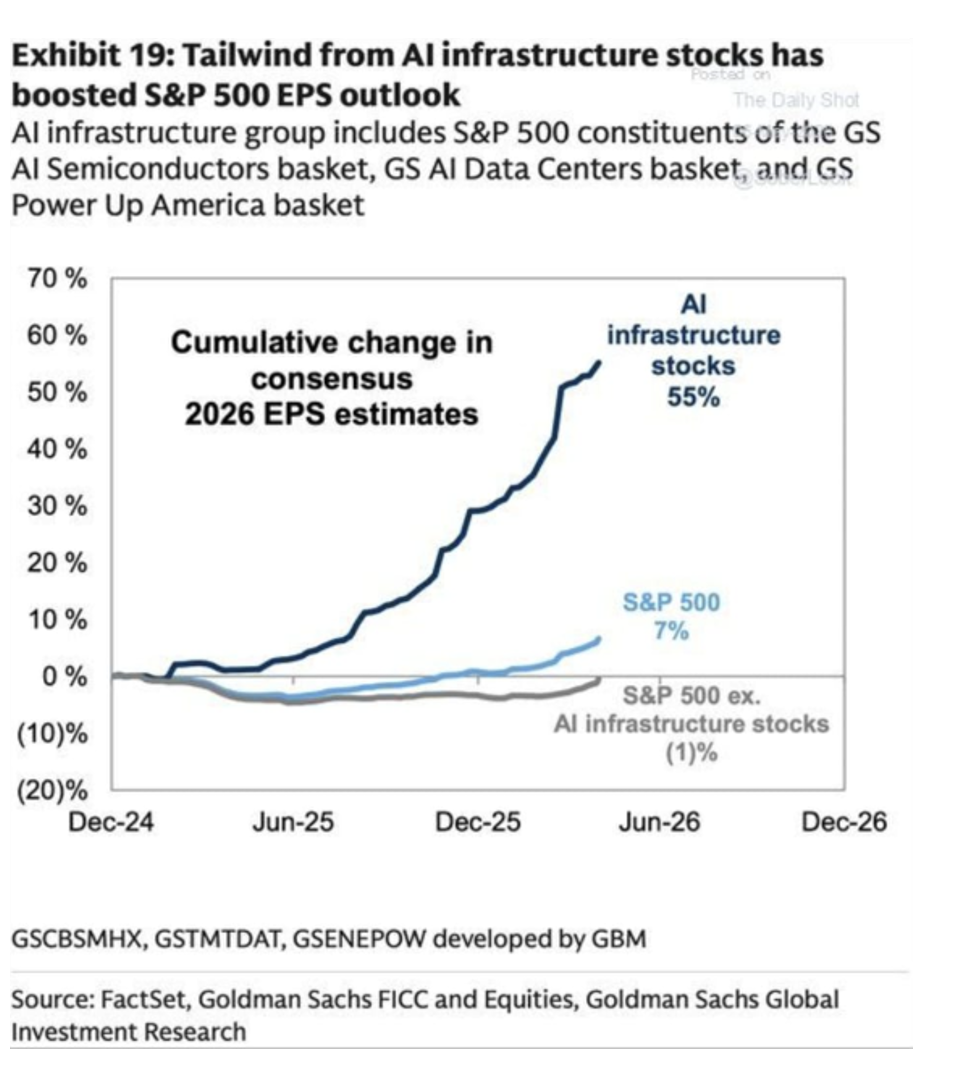
As per the Goldman Sachs Global Investment Research report below, AI infrastructure stocks provided a powerful tailwind in the United States, materially boosting S&P 500 earnings-per-share estimates.
A notable milestone was reached as Micron crossed the $1 trillion market capitalisation threshold [13], with SK Hynix quickly following suit. [14] This made South Korea the second country after the United States to have more than one company in the trillion-dollar club. [15] The breadth of investor appetite for AI-related names was unmistakable. The IPO pipeline also attracted attention, with upcoming listings (SpaceX, Anthropic and OpenAI) [16] potentially adding further momentum to market sentiment.
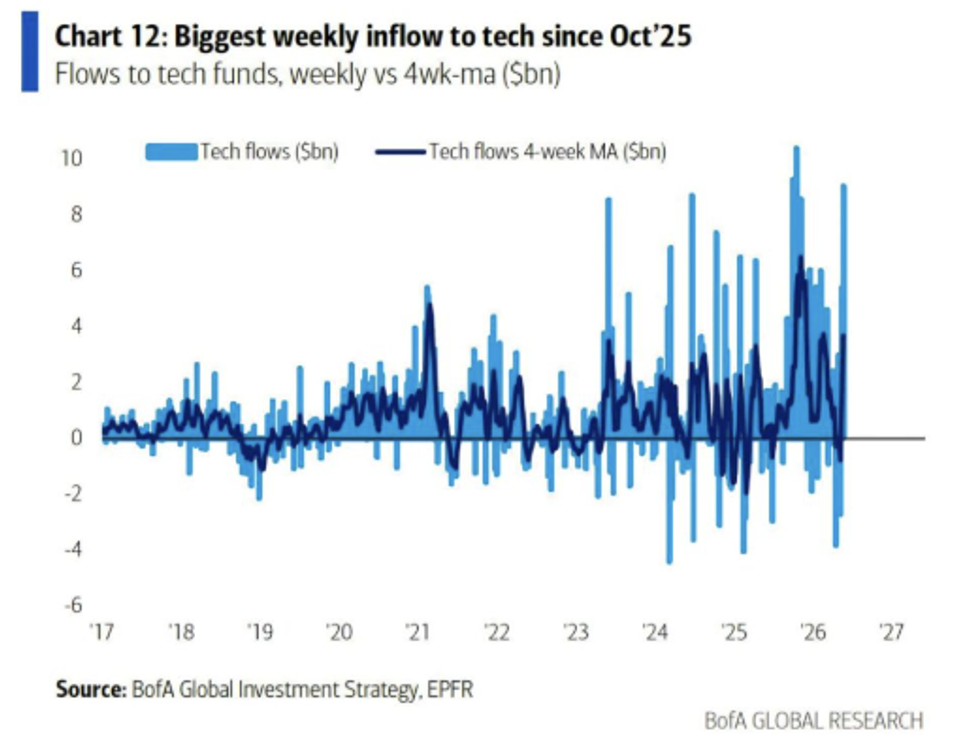
Institutional fund flows support the narrative. As the BofA chart below shows, tech funds recorded their largest weekly inflows since October 2025, reflecting the degree to which capital continues to chase AI-exposed names despite the broader macro uncertainty.
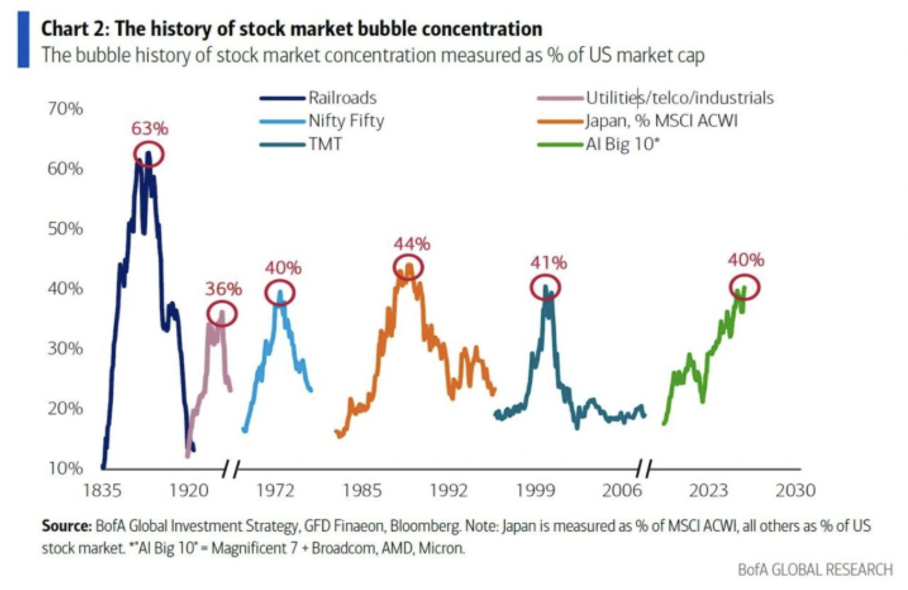
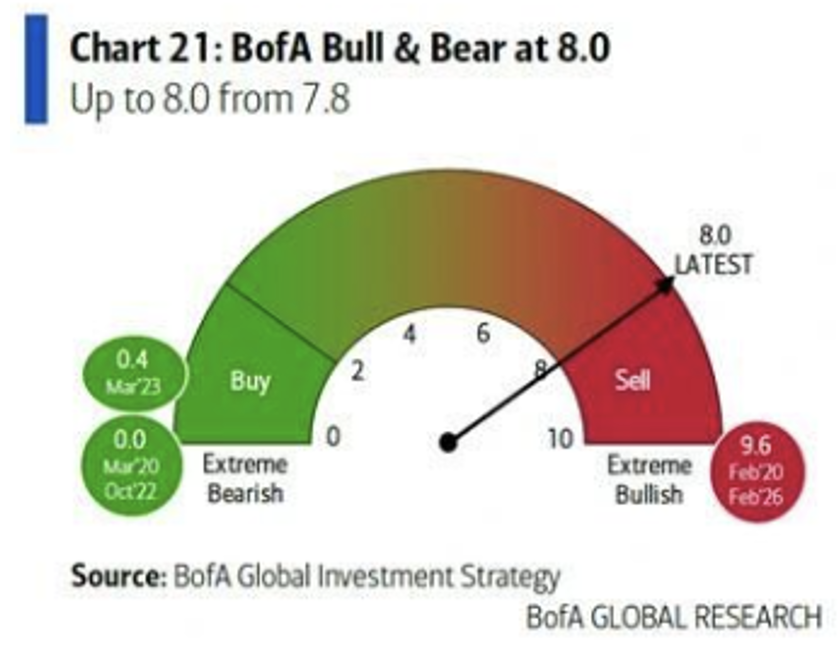
That said, the current rally may demand caution. Gains appear narrow and heavily concentrated in AI-related names, and the structural parallels to past speculative episodes are difficult to ignore. The AI mega-cap rally appears to have reached concentration levels (40% as per the published data) that match the dot-com bubble and the Nifty Fifty.
The BofA Bull and Bear indicator climbed to 8.0, up from 7.8, a level historically associated with contrarian sell signals. [17]
In Korea, this has taken a particularly acute form: single stock leveraged ETF tracking SK Hynix and Samsung has surged in popularity, amplifying both gains and potential losses. [18] On their debut day in Korea, the Samsung and SK Hynix leveraged ETFs attracted large capital inflow in a single session. On the same day, only 77 stocks on the KOSPI advanced while 826 declined, a ratio of more than 10 to 1, illustrating how narrowly the rally is concentrated. [19]
Fixed income
Government bonds sold off sharply in May 2026. [20] The common driver was inflation. Energy prices driven by the Iran war pushed investors to price in rate hikes rather than the cuts they were expecting at the start of the year. US 10-year yields edged up toward the key 4.5% [21] while the 30-year Treasury rose above 5% for the first time since 2007. [22] JGB 30-year yield breached 4% for the first time since its debut in 1999, with 20- and 40-year yields also hitting multi decade high. [23] UK gilts were hit harder than most. 30-year yields lifted to fresh recent highs while the 10-year gilts also suffered another sell-off. This reflects an additional layer of political uncertainty, as growing calls within the Labour Party for Keir Starmer to step down raised fears of a looser fiscal policy ahead. [24]
On the outlook for Federal Reserve policy, major banks have materially pushed back their rate cut expectations. The table below summarises current forecasts across key institutions:
Banks | Current Forecast | Previous Forecast |
UBS | Cut rates by 25bps in Dec 26 and Mar 27 [25] | Previously forecast 25 bps rate cuts in Sept 26 and Dec 26 |
BofA | BofA global research expects the Fed to remain on hold for the rest of this year, with two 25bps cuts in July and September 2027 [26] | – |
Standard Chartered | Pause until Q3 and then rate cut in Dec 26 [27] | – |
Goldman Sachs | Two 25bps cuts in Dec 2026 and Mar 2027 [28] | Previously forecast 25 bps rate cuts in Sept 2026 and Dec 2026 [29] |
JPMorgan | No cuts in 2026; 25bps rate hike in Q3 2027 [30] | Previously forecast one cut in Jan 2026 |
Morgan Stanley | Hold through 2026; two cuts in Mar and Jun 2027 [31] | Previously forecast cuts in Jan and Mar 2027 |
Barclays | One 25bps cut in Mar 2027 [32] | Previously forecast 25 bps rate cuts in Sept 26 and Dec 26 [33] |
The overarching fear is that elevated oil prices may keep inflation sticky, leaving the Fed reluctant to ease even as growth moderates. Markets that anticipated cuts in 2026 are now appearing to have come to terms with rates expected to remain on hold well into 2027.
Commodities & FX
The most direct impact of the Hormuz disruption has been on oil inventories. The US Strategic Petroleum Reserve fell approximately 10% in just three months. The pressure is not just America; global inventories are also drawing down at a record pace. JPMorgan predicts the ‘operational floor’ of 6.8 billion barrels could be breached by September if the strait remains closed. Below this level, pipelines cannot maintain pressure, refineries cannot function and the physical infrastructure of the oil system begins to fail regardless of what price oil is trading at. [34]
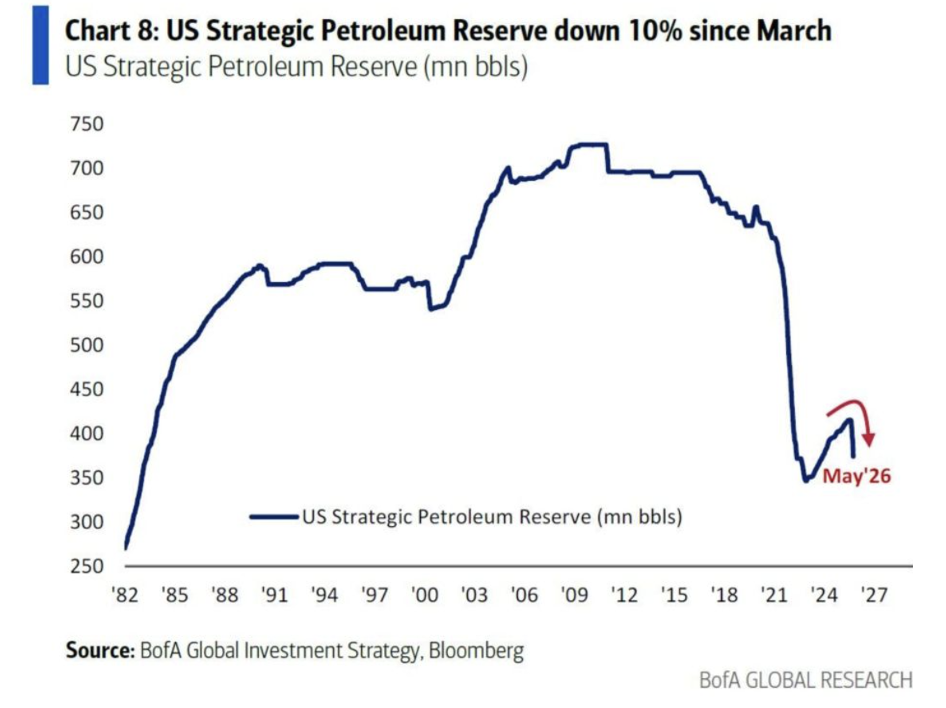
The Strait of Hormuz disruption was the dominant commodities theme in May 2026 once again. That said, oil prices have trended lower more recently as US-Iran negotiations gained traction. [35] A potential reopening by end July would provide material relief to both energy markets and inflation dynamics.
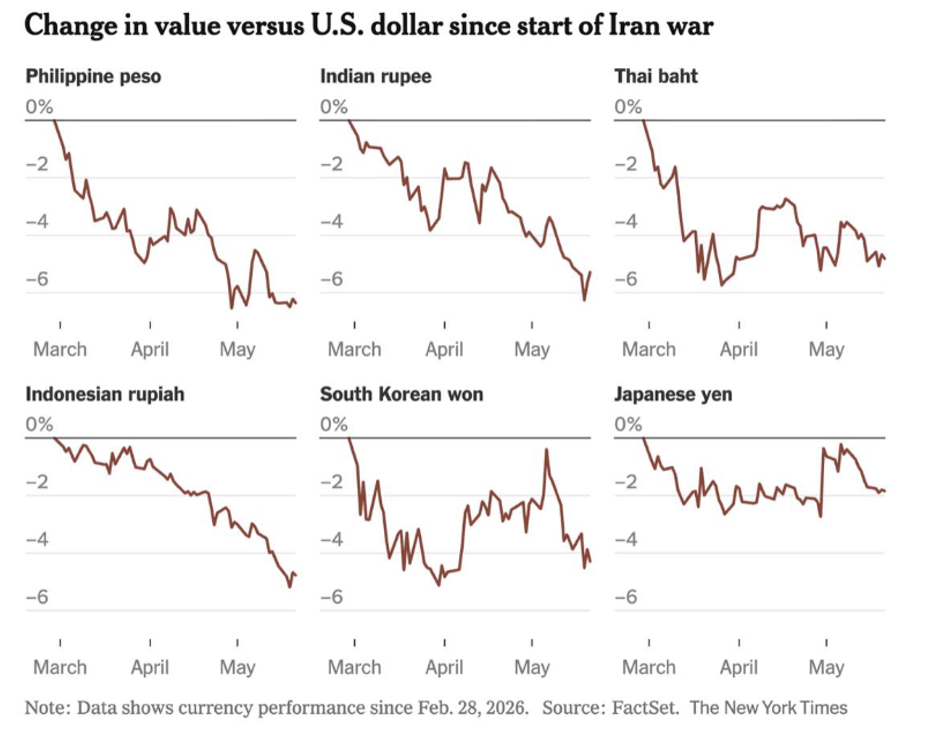
Asian currencies came under broad pressure in May 2026. The rupiah fell to 17,870 against the dollar [36], while Japan intervened in the FX market for the first time since 2024 to defend the yen near the 160 level. [37] The common driver is Asia’s heavy reliance on Middle East energy. With the Strait of Hormuz still disrupted, rising energy costs are widening current account deficits and pushing capital out of the region. Central banks can intervene and raise rates, but doing so slows growth at a time when consumers and businesses are already being squeezed. The currencies are, in effect, an early indicator of how far the oil shock’s damage is spreading beyond energy markets.
Overall Market Review
From a market-conditions perspective, concentration risk appears elevated and volatility may remain driven by geopolitics and energy prices. Readers should consider their own objectives and constraints and seek independent advice where appropriate.
Source:
[1] Axios: US, Iran reach deal to extend ceasefire | NHK WORLD-JAPAN News
[2] Iran says draft deal with US would reopen Strait of Hormuz shipping, end naval blockade – CNA
[3] Who attended Trump-Xi meeting, and why it matters – Newsweek
[4] Five takeaways from Trump and Xi’s superpower summit | The Straits Times
[5] Trump Clears Nvidia H200 Sales To Alibaba, Tencent And 8 Others, But Beijing Halts Deliveries – NVIDIA (N – Benzinga
[6] Russia, China sign over 40 documents spanning economy, energy, transport, global cooperation – AA News
[7] Us producer prices post biggest monthly jump since 2022 — Here’s what it means for rates and markets – Global Markets News | The Financial Express
[8] US inflation rose to 3.8% in April, eroding Americans’ paychecks | CNN Business
[9] Strait of Hormuz traffic returns to normal by July 31? Trading Odds & Predictions 2026 | Polymarket
[10] KOSPI surges 77% YTD: Why South Korea has become one of the world’s best-performing stock markets in 2026 | Stock Market News
[11] Taiwan Stock Market Overtakes India as World s Fifth Largest; Taiwan Weighted Index Hit Record High This Morning – AASTOCKS.com Limited
[12] Japan’s Nikkei all-time high: Stock Market today: Why is Japan’s Nikkei rising to all-time historic high? What US investors need to know about Yen’s surge – The Economic Times
[13] Micron joins $1 trillion club as AI race powers memory chip boom – Reuters
[14] SK Hynix hits $1 trillion valuation as AI boom lifts South Korean chip stocks – CNBC
[15] South Korean Firms Join Exclusive Trillion-Dollar Club – THE CHOSUN Daily
[16] SpaceX, OpenAI, Anthropic: The AI Mega‑IPO Trio Set to Reshape the S&P 500 – Finance Yahoo
[17] BofA Bull & Bear Indicator Hits 8.0, Triggers Sell Signal – NewsGlobNow
[18] South Korea to launch leveraged stock ETFs on Samsung, SK Hynix – Bloomberg
[19] Equal-Weighted ETFs Lag as Samsung, SK hynix Dominate Korean Market – Seoul Economic Daily
[20] Global bond sell-off deepens as oil, inflation fears push yields to multi-year highs – Khaleej Times
[21] 10-year Treasury yield rises to highest level in 10 months – Yahoo Finance
[22] 30-Year Treasury Auction Clears Above 5%, Highest Yield Since 2007 – Yahoo Finance
[23] Japan government bonds slide as yields rise amid global selloff – cryptobriefing.com
[24] UK borrowing costs hit 28-year high as City braces for Burnham challenge – The Independent
[25] UBS delays Fed rate cuts on inflation concerns, as jobs stay resilient | Reuters
[26] BofA and Goldman push back Fed rate‑cut expectations on inflation risks, jobs data | Reuters
[27] A fragile equilibrium – Standard Chartered Global Private Bank June 2026 Global Market Outlook
[28] Goldman Sachs delays Fed cut outlook to December 2026 as Iran war drives US inflation | Reuters
[29] J.P. Morgan forecasts 2027 Fed hike; Barclays, Goldman postpone rate cut calls | Reuters
[30] What’s The Fed’s Next Move? | J.P. Morgan Global Research
[31] Morgan Stanley expects Fed to hold rates through 2026, cut in early 2027 | Reuters
[32] Barclays Adjusts Fed Rate Cut Forecast to March 2027 | GuruFocus
[33] J.P. Morgan forecasts 2027 Fed hike; Barclays, Goldman postpone rate cut calls | Reuters
[34] World oil inventories falling fast towards hard operational floor – MSN
[35] US oil prices fall below $90 per barrel for first time since May 7 – cryptobriefing.com
[36] Expert Cites Free Meal Governance as Rupiah Breaches 17,870 per US Dollar – News En.tempo.co
[37] Japan intervention data eyed as yen hovers near 160 per dollar – The Japan Times

